


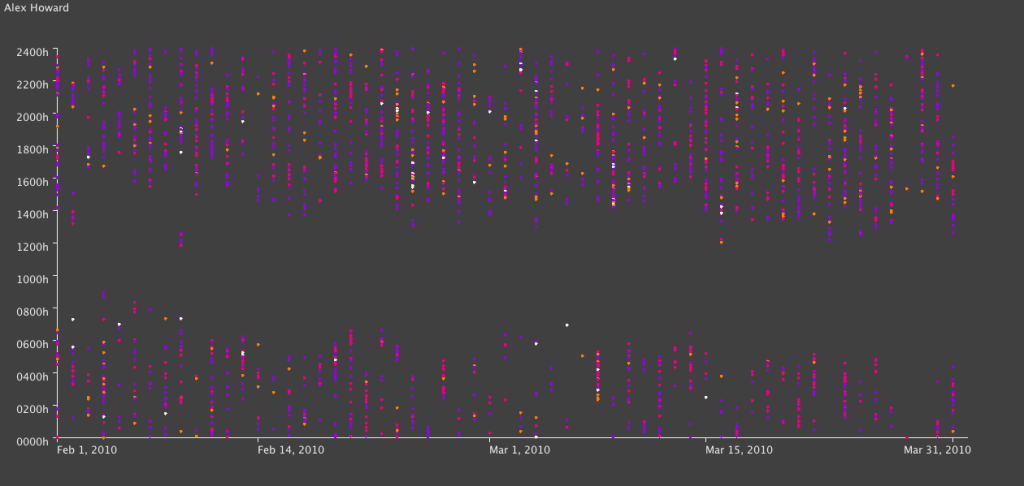
After breaking down the overall types of tweets from people, next step was to create scatter plots of their activity.
Unfortunately, Excel will only plot 250 data points – how unreasonable! Luckily I love breaking Excel and coding something that will do what I want it to do and look prettier, so voila.
Color scheme:
- Is directed at someone by starting with an @
- Contains a mention (@) of someone else
- Contains a link
Otherwise, the point for that tweet is light gray. Note this is done in the order above, so if 1 is true, then it doesn’t matter if both 2 and 3 are true or false – the tweet will be pink. If 2 is true, the tweet may or may not contain a link – it will still be purple.


I used the Processing core.jar library within Eclipse, along with the data-structures I created originally and the Apache POI code for extracting the data from Excel.
I’m enclosing the code below, with some comments:
- This code will not compile even with the Processing core.jar library (requires data-structure code that I have not yet released).
- There is a horrible hack for calculating the time passed since original date – if you’re doing anything more with time consider Joda Time instead.
- The code is written to visualize this data and only this data. Whilst I may create a proper ScatterPlot class for Processing at some point, I’ll probably wait until Java 7 because without lambda functions it will require either a standard data format, or some kind of interface hack to create an adapter pattern. I don’t like either of these approaches.
- Aside from this, if you have some other use for it feel free to ping me with questions!
package com.catehuston.caitlin.viz;

import java.io.IOException;
import java.util.Calendar;
import java.util.Date;

import com.catehuston.caitlin.datastructures.Tweet;
import com.catehuston.caitlin.datastructures.User;
import com.catehuston.caitlin.parse.UserList;

import processing.core.PApplet;

@SuppressWarnings("serial")
public class Scatterplot extends PApplet {

	private static final int w = 1260; // 1160 for graph
	private static final int h = 600; // 480 for graph

	// spacing at either side
	private static final int xmargin = 70;
	private static final int ymargin = 60;

	// axis length
	private static final int xlen = w-(xmargin*2);
	private static final int ylen = h-(ymargin*2);

	// increments for day, hour, minute
	private static final int di = xlen/58;
	private static final int hi = ylen/24;
	private static final double mi = hi/60d;

	// user we're graphing
	private int index = 5;
	private User user;

	// calendar for date comparison
	Calendar startDate;

	public void setup() {
		UserList ul;
		try {
			// generate user list from spreadsheet
			ul = new UserList("../data/data_june16_top20.xls");
		} catch (IOException e) {
			// TODO Auto-generated catch block
			e.printStackTrace();
			return;
		}

		// get data just for the user we're interested in
		user = ul.get(index);

		// set applet size
		size(w, h);

		// draw() method will be called only once
		noLoop();

		// set up calendar with base date
		startDate = Calendar.getInstance();
		startDate.set(Calendar.YEAR, 2010);
		startDate.set(Calendar.MONTH, Calendar.FEBRUARY);
		startDate.set(Calendar.DAY_OF_MONTH, 1);
		startDate.set(Calendar.HOUR_OF_DAY, 0);
		startDate.set(Calendar.MINUTE, 0);
	}

	public void draw() {
		// set background color - dark grey
		background(64);

		// set foreground color for text and axes - light grey
		stroke(238);
		fill(238);

		// draw user name string top left
		text(user.getUser(), 5, 15);

		// draw x-axis
		int ypos = ylen+ymargin;
		line(xmargin, ypos, xmargin + xlen, ypos);
		// add major markers

		// initial
		line(xmargin, ypos, xmargin, ypos+5);
		text("Feb 1, 2010", xmargin, ypos+20);

		// mid-feb
		int inc = 13*di;
		line(xmargin + inc, ypos, xmargin + inc, ypos+5);
		text("Feb 14, 2010", xmargin + inc, ypos+20);

		// start of march
		inc = 28*di;
		line(xmargin + inc, ypos, xmargin + inc, ypos+5);
		text("Mar 1, 2010", xmargin + inc, ypos+20);

		// mid march
		inc = inc + 14*di;
		line(xmargin + inc, ypos, xmargin + inc, ypos+5);
		text("Mar 15, 2010", xmargin + inc, ypos+20);

		// end of march
		inc = 58*di;
		line(xmargin + inc, ypos, xmargin + inc, ypos+5);
		text("Mar 31, 2010", xmargin + inc - 60, ypos+20);

		// draw y-axis
		line(xmargin, ymargin, xmargin, ypos);
		// add markers
		for (int i = 0; i < 2401; i+=200) {
			inc = i/100*hi;
			ypos = ymargin + ylen - inc;
			line(xmargin-5, ypos, xmargin, ypos);
			String hrs = i + "h";
			if (i == 0) {
				hrs = "0000h";
			}
			else if (i < 1000) {
				hrs = "0" + hrs;
			}
			text(hrs, xmargin-50, ypos+10);
		}

		// go through and plot points, color according to type
		for (Tweet t : user.getTweets()) {
			// set color according to tweet type
			// @ message
			if (t.isDirected()) {
				// pink
				stroke(236, 0, 128);
				fill(236, 0, 128);
			}
			// someone else is mentioned
			else if (t.isMention()) {
				// purple
				stroke(140, 9, 214);
				fill(140, 9, 214);
			}
			// contains link
			else if (t.hasLink()){
				// yellow
				stroke(255, 126, 0);
				fill(255, 126, 0);
			}
			// otherwise
			else {
				stroke(238);
				fill(238);
			}

			Date d = t.getDate();
			int x = getXPos(d);
			int y = getYPos(d);
			ellipse(x, y, 3, 3);
		}
	}

	private int getXPos(Date date) {
		// make calendar with specified date
		Calendar newDate = Calendar.getInstance();
		newDate.setTime(date);

		// count how many days we go back to find start date
		int count = -1;
		while(startDate.before(newDate)) {
			count++;
			newDate.add(Calendar.DATE, -1);
		}

		return xmargin + count * di;
	}

	private int getYPos(Date date) {
		// put date in calendar so we can manipulate it
		Calendar time = Calendar.getInstance();
		time.setTime(date);

		// work out hour increment
		int hrs = time.get(Calendar.HOUR_OF_DAY) * hi;
		// wor out minute increment
		double mins = time.get(Calendar.MINUTE) * mi;

		// return y value
		return (int) (ylen + ymargin - hrs - mins);
	}
}