Tag: processing

  • More Experiments Around RGB Averaging

    More Experiments Around RGB Averaging

    I decided to replicate the showing/hiding the dominant hues in images with showing/hiding around the average RGB values instead.

    I created a class called RGBColor (just holds red, green, and blue values), similar to the one I created called HSBColor. I could have used the java.awt.Color class, but that insists on a range of 0-1 for the values, and I wanted to avoid conversions between that and the 0-255 that Processing uses by default. Or, better, allow me to set the colorMode to be in range 1-100, so that my tolerances were percentages – I found this made it easier to pick good values there.

    Images Showing Colors Around “Average” RGB

    Images Hiding Colors Around “Average” RGB

    Source Code

    package ui;
    
    import model.RGBColor;
    import color.ColorHelper;
    import processing.core.PApplet;
    import processing.core.PImage;
    
    @SuppressWarnings("serial")
    public class AverageRGBImageViewApplet extends PApplet {
    
    	PImage img;
    	static final int rgbTolerance = 50;  // Adjust this.
    
    	public void setup() {
    		size(640,480);
    		background(0);
    		img = loadImage(/* Your image file here */);
    		colorMode(RGB, 100);
    		processImage();
    	}
    
    	public void draw() {
    		image(img, 0, 0, 640, 480);
    	}
    
    	private void processImage() {
    		RGBColor color = ColorHelper.rgbColorFromImage(img, this);
    
    		for (int i = 0; i < img.pixels.length; i++) {
    			int pixel = img.pixels[i];
    			RGBColor pxColor =
    				new RGBColor(red(pixel), green(pixel), blue(pixel));
    			// Adjust this conditional to show/hide around average rgb.
    			if (!rgbInRange(color, pxColor, rgbTolerance)) {
    				float brightness = brightness(pixel);
    				img.pixels[i] = color(brightness);
    			}
    		}
    	}
    
    	private boolean rgbInRange(RGBColor colorA, RGBColor colorB, int tolerance) {
    		return Math.abs(colorA.r - colorB.r) < tolerance &&
    			Math.abs(colorA.g - colorB.g) < tolerance &&
    			Math.abs(colorA.b - colorB.b) < tolerance;
    	}
    }

    ColorHelper.java

    package color;
    
    import processing.core.PApplet;
    import processing.core.PImage;
    import model.RGBColor;
    
    public class ColorHelper {
    
    	public static RGBColor rgbColorFromImage(PImage img, PApplet applet) {
    		img.loadPixels();
    		int numberOfPixels = img.pixels.length;
    		float totalRed = 0f;
    		float totalGreen = 0f;
    		float totalBlue = 0f;
    
    		for (int i = 0; i < numberOfPixels; i++) {
    			int pixel = img.pixels[i];
    			totalRed += applet.red(pixel);
    			totalGreen += applet.green(pixel);
    			totalBlue += applet.blue(pixel);
    		}
    
    		// Calculate final rgb values.
    		float r = totalRed / numberOfPixels;
    		float g = totalGreen / numberOfPixels;
    		float b = totalBlue / numberOfPixels;
    		return new RGBColor(r, g, b);
    	}
    }
  • Eliminating the Dominant Hue from an Image

    Eliminating the Dominant Hue from an Image

    I thought it would be interesting to invert the idea of showing only the dominant hue, and show everything but that instead. I used the exact same code, but inverted the if statement so:

    if (!hueInRange(hue, lower, upper))

    became

    if (hueInRange(hue, lower, upper))

    Effect is as follows, as with most of these, my favourite effect is on the painting – does it work better because it is a more studied use of color? I’m going to make something that will compare and contrast the effects, and allow me to loop through pictures so I can look for interesting results.

  • Showing Only the Dominant Hue In an Image

    Showing Only the Dominant Hue In an Image

    Having extracted the dominant hue from the images, we can manipulate the image such that pixels that are not (or close to) the dominant hue are instead made grayscale.

    I converted to grayscale using the brightness of the image in the HSB. This worked really nicely.

    From my earlier experiments I decided on a hue range of 320 (320 buckets).

    I varied the tolerance (from 1 – 20) of how far away from the dominant hue we would show on the same four images, with varying results of aesthetic pleasingness. How dominant the dominant color in the image is really varies the effect. One of them, pretty much didn’t work at all until I hit a tolerance of about 55 – at which point, 1/3 of the spectrum.

    import processing.core.PApplet;
    import processing.core.PImage;
    
    @SuppressWarnings("serial")
    public class DominantHueImageViewApplet extends PApplet {
    
    	PImage img;
    	static final int hueRange = 320; 
    	static final int hueTolerance = 10;  // Adjust this.
    
    	public void setup() {
    		size(640,480);
    		background(0);
    		img = loadImage("" /* Your image goes here */);
    		colorMode(HSB, (hueRange - 1));
    		processImage();
    	}
    
    	public void draw() {
    		image(img, 0, 0, 640, 480);
    	}
    
    	private void processImage() {
    		img.loadPixels();
    		int numberOfPixels = img.pixels.length;
    		int[] hues = new int[hueRange];
    		float[] saturations = new float[hueRange];
    		float[] brightnesses = new float[hueRange];
    
    		for (int i = 0; i < numberOfPixels; i++) {
    			int pixel = img.pixels[i];
    			int hue = Math.round(hue(pixel));
    			float saturation = saturation(pixel);
    			float brightness = brightness(pixel);
    			hues[hue]++;
    			saturations[hue] += saturation;
    			brightnesses[hue] += brightness;
    		}
    
    		// Find the most common hue.
    		int hueCount = hues[0];
    		int dominantHue = 0;
    		for (int i = 1; i < hues.length; i++) {
     			if (hues[i] > hueCount) {
    				hueCount = hues[i];
    				dominantHue = i;
    			}
    		}
    
    		// Manipulate photo, grayscale any pixel that isn't close to that hue.
    		int lower = dominantHue - hueTolerance;
    		int upper = dominantHue + hueTolerance;
    		print("dominentHue" + dominantHue);
    		for (int i = 0; i < numberOfPixels; i++) {
    			int pixel = img.pixels[i];
    			float hue = hue(pixel);
    			if (!hueInRange(hue, lower, upper)) {
    				float brightness = brightness(pixel);
    				img.pixels[i] = color(brightness);
    			}
    		}
    	}
    
    	private static boolean hueInRange(float hue, int lower, int upper) {
    	        // Should compensate for it being circular here - can go around.
                    return hue < upper && hue > lower;
    	}
    }
  • Extracting Dominant Color: RGB Averaging Doesn’t Work

    Extracting Dominant Color: RGB Averaging Doesn’t Work

    This makes sense – two colors can have the same R values, but wildly different G and B values. The result of averaging them will bear no relation to the originals.

    However just to prove it, it was very easy to tweak my code to average the RGB values instead of counting the hues. The result for the same four photos is as follows. If the color is really prevalent, the result isn’t so different, but in the case where it isn’t, this way doesn’t really work at all.

    Source Code

    package ui;
    
    import processing.core.PApplet;
    import processing.core.PImage;
    
    @SuppressWarnings("serial")
    public class RGBImageViewApplet extends PApplet {
    
    	PImage img;
    	float r;
    	float g;
    	float b;
    
    	public void setup() {
    		size(640,600);
    		background(0);
    		img = loadImage("" /* Your image here */);
    		colorMode(RGB);
    		extractColorFromImage();
    	}
    
    	public void draw() {
    		image(img, 0, 0, 640, 480);
    		fill(r, g, b);
    		rect(0, 480, 640, 120);
    	}
    
    	private void extractColorFromImage() {
    		img.loadPixels();
    		int numberOfPixels = img.pixels.length;
    		float totalRed = 0f;
    		float totalGreen = 0f;
    		float totalBlue = 0f;
    
    		for (int i = 0; i < numberOfPixels; i++) {
    			int pixel = img.pixels[i];
    			totalRed += red(pixel);
    			totalGreen += green(pixel);
    			totalBlue += blue(pixel);
    		}
    
    		// Set the vars for displaying the color.
    		r = totalRed / numberOfPixels;
    		g = totalGreen / numberOfPixels;
    		b = totalBlue / numberOfPixels;	
    	}
    }
  • Extracting the Dominant Color from an Image in Processing

    Extracting the Dominant Color from an Image in Processing

    I’ve had an idea in mind for a while now, that requires extracting the dominant color from an image. I had no idea how to do this, and worried it would be really hard.

    The first thing was extracting the pixels from the image for processing, this was super easy thanks to this handy image processing tutorial.

    Some Googling took me to Stack Overflow (always a great starting point) and I discovered the concept of color “bins” – this makes sense, I’d imagine it’s quite possible that all pixels in an image are subtly different, and actually you want to group them in some way. This led me to find out about calculating distances between colors, which is a solved problem, but somewhat complicated.

    Finally I ended up looking at HSB colors – hue, saturation, brightness, and this really simple tutorial. Colors are represented on a cone, and the values are as follows (from the tutorial).

    Hue is the actual color. It is measured in angular degrees counter-clockwise around the cone starting and ending at red = 0 or 360 (so yellow = 60, green = 120, etc.).

    Saturation is the purity of the color, measured in percent from the centre of the cone (0) to the surface (100). At 0% saturation, hue is meaningless.

    Brightness is measured in percent from black (0) to white (100). At 0% brightness, both hue and saturation are meaningless.

    At this point, it was clear to me that what I really wanted to do was to extract the dominant hue, and then I planned to average the brightness and the saturation. In the end, I decided to average the brightness and saturation for that hue, rather than for the entire image.

    After this, it should have been easy, but I had some confusion in terms of the range of hues, and converting from HSB to RGB. This I eventually fixed by just setting the ColorMode and working purely in HSB. The ColorMode allows me to set the maximum range, and as I just round the float to an int I can make my buckets bigger or smaller according to that. It turned out that 360 ended up being pretty close to what I want, although I think 320 is slightly better! It’s interesting to see the change of the extracted “dominant” color as the buckets change in size.


    If you liked this, you might also be interested in: Colors of the Internet (which I found as I was waiting for pictures to upload to this post – beautiful timing!)

    Source Code

    import processing.core.PApplet;
    import processing.core.PImage;
    
    @SuppressWarnings("serial")
    public class ImageViewApplet extends PApplet {
    
    	PImage img;
    	float hue;
    	static final int hueRange = 360; 
    	float saturation;
    	float brightness;
    
    	public void setup() {
    		size(640,600);
    		background(0);
    		img = loadImage("" /* Your image here */);
    		colorMode(HSB, (hueRange - 1));
    		extractColorFromImage();
    	}
    
    	public void draw() {
    		image(img, 0, 0, 640, 480);
    		fill(hue, saturation, brightness);
    		rect(0, 480, 640, 120);
    	}
    
    	private void extractColorFromImage() {
    		img.loadPixels();
    		int numberOfPixels = img.pixels.length;
    		int[] hues = new int[hueRange];
    		float[] saturations = new float[hueRange];
    		float[] brightnesses = new float[hueRange];
    
    		for (int i = 0; i < numberOfPixels; i++) {
    			int pixel = img.pixels[i];
    			int hue = Math.round(hue(pixel));
    			float saturation = saturation(pixel);
    			float brightness = brightness(pixel);
    			hues[hue]++;
    			saturations[hue] += saturation;
    			brightnesses[hue] += brightness;
    		}
    
    		// Find the most common hue.
    		int hueCount = hues[0];
    		int hue = 0;
    		for (int i = 1; i < hues.length; i++) {
     			if (hues[i] > hueCount) {
    				hueCount = hues[i];
    				hue = i;
    			}
    		}
    
    		// Set the vars for displaying the color.
    		this.hue = hue;
    		saturation = saturations[hue] / hueCount;
    		brightness = brightnesses[hue] / hueCount;
    	}
    }
  • 4 Hours to Smash the CS Stereotype and Create Something Beautiful

    4 Hours to Smash the CS Stereotype and Create Something Beautiful

    Ali and I will presenting our paper 4 Hours to Smash the CS Stereotype and Create Something Beautiful (pdf) at the upcoming CICE Education conference in Toronto.

    Christine Alvarado of Harvey Mudd college came to Google last month to gave a talk on how they’d brought female enrollment in Computer Science up to 42%. The talk is called “Three Promising Practices”, and one of those practices was a redesign of the CS1 curriculum (you can watch the video here, it’s over an hour long).

    They dived into the feedback about the old curriculum, and what they found was that people who were already into CS loved it. And those that weren’t, their minds weren’t changed after a semester of CS.


    Haribo Micro Mix
    Credit: flickr / Caro Wallis

    When I TA’d a mandatory CS course for business students, I was so frustrated by what I saw as a missed opportunity. We had these students, who were bright, and tech-savvy by virtue of when they’d grown up and we had this space where we could educate them about what CS is, and why it’s awesome… and it was wasted. This course didn’t just not make the students want to study CS, it make them actively dislike it. They hated it. And honestly, I sympathized with them. So the Harvey Mudd talk was fascinating to me, because I think it shows how big an opportunity we miss by not creating curriculum designed to engage students who hadn’t planned on taking CS already.

    And I think this is a huge problem. I actually work for Google now, and I was trying to explain what I do to someone who isn’t really technical and she said, “oh, you work for the internet”. I wasn’t quite sure what to say to that! But what is true is that collectively, computer scientists, software engineers, we’re building this digital future. And I think it’s important that that group of people is as diverse as possible.

    Curriculum Screenshot

    At uOttawa, we had the opportunity to create a curriculum for a four hour workshop that’s run for high school students, at around the time they’re thinking about what to take at university. This build on work that I’d done in my previous curriculum, in terms of visual honesty.

    The most interesting aspect that drove the design was just throwing out any expectation at the start that the students had any interest in, or experience of, CS. This was our opportunity to sell them on CS, to smash that stereotype.

    Feedback from post-workshop surveys suggests that we’ve had some success with this, despite the short time frame of the workshop. Because the curriculum is open source, we hope that it will be able to be used elsewhere as well.

    I’m going to talk about the design decisions we made, and why these were important.

    1. Entirely Visual

    webOne of the things that we’ve observed students to get frustrated by is lack of visual honesty in programming. Often in problems we pose to students, it’s a case of inputs in, outputs out. The program is a black box, and when the wrong answer comes out of this black box, students often don’t understand why, or how it’s going wrong.

    When we cerate visual programs instead, it’s so much clearer. The line is not where it should be, or the circle is smaller than expected. It becomes a lot clearer what kind of mistake they’re looking for.

    2. Activity Based

    Credit: xkcd

    Don Norman wrote about activity centred design in terms of remote controls (amongst other things). It’s a plea to designers to design for what people want to achieve, rather than how to do it. We’ve taken that approach here. Rather than following the traditional path of thing to learn, followed by contrived example, we present things they may actually want to do, and then explain how to go about doing them.

    We’re not expecting students to go away with a thorough grasp of the constructs, so it doesn’t matter if they master if statements but not loops. This means that we’ve made it so that the modules are stand alone as possible. We’re not telling them what to do. We’re asking them what they want to achieve.

    3. Open Source

    Processing Website Screenshot

    We deliberately chose to make the curriculum as open as possible – in every sense. We use the open source software Processing, which runs on Mac OS, Linux as well as on Windows. The curriculum itself is also licensed under creative commons.

    This has the big benefit of reducing as much as possible the barriers to students continuing at home or at school – the software is free, and compatible with whatever operating systems they use.

    4. TAs


    The J Clique
    Credit: flickr / Xpectro

    We were extremely selective about hiring TAs. We aimed for a ratio of 4 students to each TA, as being stuck and having to wait for someone to help you is so frustrating to students, and we wanted to keep that as minimal as possible. In hiring TAs, we were looking for strong problem solving and coding skills, and as importantly, excellent communication skills. We were looking for TAs who were fun for the students to interact with, who would be role models. Our TAs are potentially our biggest asset in smashing that stereotype, so it’s really important that they are awesome.

    5. Self-Directed

    Direction arrow
    Credit: David Baird, http://www.geograph.org.uk/photo/775326

    The low ratio of students to TAs allows us to give students the freedom to work at their own pace, on what interests them. Students with prior programming experience will often skip to the more advanced modules, and students who are less comfortable can take a slower pace, or focus on more math-based activities, such as fractals.

    6. Inclusive of Interests and Levels

    We provide a mix of modules, ranging from complete beginner to more advanced and students are welcome to come up with other things to create, or find more information on the internet. Often students want to make games, so we facilitate that with a pacman-like framework (we’d like to add Brick Breaker soon), but we also have several fractals, for more math-loving or artsy students.

    The students are challenged to “make something beautiful”. It’s always interesting to see what they come up with! This open-ended approach means there are always extra challenges – for example, animation! Students have also started to explore Processing’s 3D capabilities.

    We take a very open approach, encouraging students to look things up on the internet, and even to share things they create on social networking sites like Facebook.

    Overall

    We’ve found our experience tremendously rewarding. Curriculum development is a design activity, and approaching it with some different constraints has been interesting. We’re very encouraged by the success of our program, and other curricula designs in attracting different types of students into CS and we hope to continue our work further, by partnering with other universities and organizations to bring the curriculum to them and expand it further.

  • Sunflower Layout in Processing

    Sunflower Layout in Processing

    For a while, I’ve been wanting to make something that explores color in photo sets. Reading Beautiful Visualization (Amazon), I came across the perfect way to arrange the elements. It imitates the layout of the sunflower seeds, “the most efficient and visually mesmerizing way of packing small elements into a large circle”.

    I decided to try the layout in Processing and to keep it simple, by following an easy rule for creating color. Start with black (the absence of color) and add red, then when red was saturated add blue, and finally green until we reach white. Because there is no yellow in the pattern, I used yellow for the background.

    I’m not entirely happy with the very centre (I think this is a consequence of having to convert between double and float) but it’s pretty cool:

    Using a different strategy for changing color (essentially generating every even numbered RGB value) with smaller radius and spacing, I made the image below.

    I love this layout!

    I use Java in Eclipse with the core.jar library. You can use this code in the Processing Editor with some small modifications.

    Code

    import processing.core.PApplet;
    
    
    public class SunflowerSeeds extends PApplet {
    	
    	private static final int radius = 10;
    	private static final int scale = 7;
    	
    	private static final double goldenangle = Math.PI * (3 - Math.sqrt(5));
    	
    	private static final int wh = 400;
    	
    	public void setup() {
    		size(wh, wh);
    		background(255, 255, 0);
    		noLoop();
    	}
    
    	public void draw() {
    		int r = 0;
    		int g = 0;
    		int b = 0;
    		
    		int n = 0;
    		
    		double a = 0;
    	
    		while (g < 255) {
    			if (r < 255) {
    				r++;
    			}
    			else if (b < 255) {
    				b++;
    			}
    			else {
    				g++;
    			}
    			
    			double h = Math.sqrt(n)*scale;
    			double x = wh/2 + Math.sin(a) * h;
    			double y = wh/2 + Math.cos(a) * h;
    			
    			stroke(0);
    			fill(r, g, b);
    			ellipse((float) x, (float) y, radius, radius);
    			
    			a+=goldenangle;
    			n++;
    		}
    	}
    }
    

    Code for Animated Version

    import processing.core.PApplet;
    
    public class SunflowerAnimated extends PApplet{
    
    	private static final int radius = 10;
    	private static final int scale = 7;
    
    	private static final double goldenangle = Math.PI * (3 - Math.sqrt(5));
    
    	private static final int wh = 400;
    
    	private int r = 0;
    	private int g = 0;
    	private int b = 0;
    
    	private int n = 0;
    	private double a = 0;
    
    	public void setup() {
    		size(wh, wh);
    		background(255, 255, 0);
    	}
    
    	public void draw() {
    		if (g >= 255) {
    			noLoop();
    			return;
    		}
    		else if (r < 255) {
    			r++;
    		}
    		else if (b < 255) {
    			b++;
    		}
    		else {
    			g++;
    		}
    
    		double h = Math.sqrt(n)*scale;
    		double x = wh/2 + Math.sin(a) * h;
    		double y = wh/2 + Math.cos(a) * h;
    		a+=goldenangle;
    		stroke(0);
    		fill(r, g, b);
    		ellipse((float) x, (float) y, radius, radius);
    
    		n++;
    	}
    }
  • Experimenting with a Visual, Activity-Based Curriculum

    Experimenting with a Visual, Activity-Based Curriculum

    When I left Ottawa, I had to find the new me to run my Processing Workshop. His name is Ali and he’s awesome. He’s had the idea to write up the ideas into a paper, so we’re working on that at the moment, but it occurred to me that I didn’t write much about it here.

    I will definitely post more as this project progresses, but for now I’m going to write up some of the design decisions that I think make this different. Comments welcome – it’ll help us write a better paper – or decide it’s not worth the effort!

    web

    Entirely Visual

    This started when I was teaching programming in the US. Kids taking the other courses were taking home video games, even 3D ones, and so my little programmers weren’t overly excited by the idea of taking home a text-based hangman – and, well, who can blame them?

    So we came to an agreement – we designed something together and I coded the GUI and each of them coded their own back-end. I developed more such frameworks the following summer and eventually got asked to develop the curriculum for all of the US.

    There, I introduced early concepts using Processing (a language and editor for teaching and artists – makes it really easy to create visual applets) as a library within Eclipse. Some students would code their final projects in Processing, but they had the option of a (Swing) framework. I negotiated my contract such that whilst they owned what I wrote, I licensed them the code I wrote (and retained the IP).

    The latest curriculum is designed for one day workshops. Eclipse is an extremely complex and powerful program and has a steep learning curve. The Processing editor is very simple and easy to use and removes some of the syntax necessary to create an applet, so we use that instead.

    Every exercise has a visual outcome. Students can compare what they have produced to the one in the instructions. This provides visual honesty that is lacking in text-based programming applications. By working visually, we turn the program from a “black-box” where the student often does not understand the relationship between the input and output… into a colourful one.

    Activity-Based

    I remember learning to program, and I noticed this pattern:

    1. Introduce concept
    2. Provide contrived example.

    I’ve taught like this too. But – why? That’s not how I code. That looks more like:

    1. Evaluate problem.
    2. Apply solution, that I know/look up/invent (for more complex problem).

    Contrived examples are 1) boring, and 2) patronizing. Instead, we present things that the student might want to do, for example – repeat things, or sometimes do one thing, sometimes do another, and provide code with an explanation.

    For a one-day workshop, we cannot expect the students to memorize concepts and it seems unreasonable to expect them to be interested in doing so. Our focus is on showing them how we can solve problems using code and why that is fun.

    Open Source

    Everything about our workshop is Open Sourced. The content is licensed under a Creative Commons Attribution-NonCommercial license. Similarly, the Processing library is licensed under the LGPL. So students and teachers can distribute their code without concern, but more importantly – students and their teachers can download the software at home or at school free of charge, and continue to explore the modules in their own time.

    TAs

    A low ratio of students to TAs (4 students to each TA) was a key part of the strategy for the workshop. Being stuck, and having to wait, is extremely frustrating to a student. Also, more one-on-one help from a TA makes it possible for students to tackle more challenging projects.

    I was extremely picky about TAs and interviewed them with technical questions, not just experience questions. I was looking for fast problem solving, and good clear communication of their solution (and in general).

    With the short time available for the workshop it was really important that the TAs could fix problems quickly. The key was to keep students moving through the content and feeling like they were progressing – the number one purpose of the workshop was to inspire them to take computer science, rather than to memorize concepts.

    Communication was really important – firstly, because a more effective communicator will teach students concepts faster. Secondly, to break the stereotype of CompSci students as socially inept and not fun to hang out with. I was really looking for people who I felt would be good role models for the students. This included not restricting TAing to graduate students, who often code infrequently anyway. For the first workshop, I hired 4 graduate students and two talented undergraduate students as TAs. They were all fantastic. Our second workshop was organized with less notice, but rather than compromise on the quality of TAs we had a slightly higher ratio (5-6 students per TA). Ideally, we will go with the lower ratio but this ratio was workable.

    Self-Directed

    Related to the low ratio of students to TAs, was the self-directed nature of the workshop. Because the curriculum is available online, there is no need to share printed copies, or wait for the instructor to explain things. Whilst the first couple of modules were necessary to give students familiarity with Processing, students with prior programming experience could quickly skip ahead to more advanced examples. Where possible the modules were written to be stand-alone, so no specific path was necessary. Having a good selection of modules meant that students didn’t have to work on the same “final” thing as their friends, if they didn’t want to.

    Inclusive of Interests and Levels

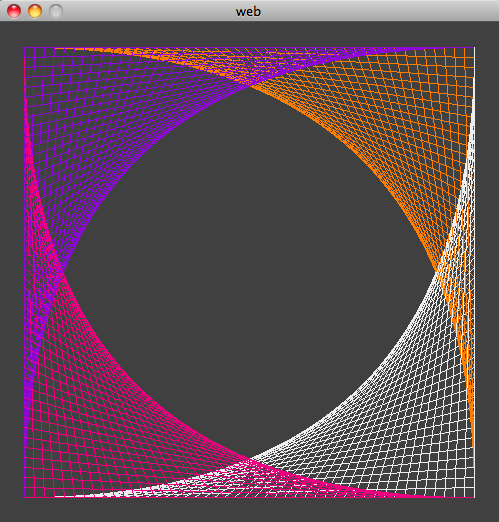
    Processing is designed as a tool for artists, and there are several modules involving creating fractals and showing students how to create patterns. Creating games is often used to engage kids and teenagers in wanting to learn to code, but by allowing this alternative, artistic track, we hope to broaden the reach of our workshop. But, if they want, there’s a framework for a simplified game of Pacman. We plan to add more games, such as BrickBreaker, over the next few months (subject to funding).

    Some students come with prior programming knowledge, and others do not. We will sometimes run a workshop for multiple schools simultaneously, and we don’t know what background knowledge the students have. This is in addition to the usual issues of different abilities! We have a mix of modules of varying challenges; for example, the most tricky parts of the fractals and patterns is the math, so students less comfortable writing code can work on those. An open-ended attitude means that there is always additional challenges, for example – animation! Students with prior knowledge of programming will often define their own challenge, or even look elsewhere on the internet and explore the 3D capabilities of Processing.

    Overall

    Honestly, I think computer science tends to be really appallingly taught. I don’t pretend to know how we should do it, but we need to do better. It’s great if people want to use, or critique what I’ve created, but the big thing is – I think it’s important that we have a conversation about how to make CS more engaging, whilst still teaching the skills that students need. They need to be able to code, not just write Java with the help of Eclipse.

    You can find the workshop here

  • Part 6: Who’s Talking About The Future of Newspapers?

    Continued on from Part 5, exploring what they are saying using the Phrase Net visualization from Many Eyes.

    Each image is a link to the applet where you can explore the text and interact with it. Change the linking word on the left – I’ve used space, but “and” or “is” in particular could be enlightening.

    I like this visualization because it shows what goes together. The fact that “globe” and “mail” are linked by “and” is perhaps not unexpected, but what does “Google” link to? News? Facebook? Buzz? What do these link to in turn – privacy? Social networking?

    Let me know what you find!

    Alex Howard
    C50006f8-b5bd-11df-a110-000255111976 Blog_this_caption
    Alfred Hermida
    3c32f410-b5be-11df-b20a-000255111976 Blog_this_caption
    Andrew Keen
    6f68e268-b5be-11df-b20a-000255111976 Blog_this_caption
    Cody Brown
    8f5eb00c-b5be-11df-a76f-000255111976 Blog_this_caption
    Dan Gillmor
    B4982ee8-b5be-11df-a76f-000255111976 Blog_this_caption
    Dave Winer
    D760ac34-b5be-11df-947b-000255111976 Blog_this_caption
    David Cohn
    09b1aecc-b5bf-11df-947b-000255111976 Blog_this_caption
    David Eaves
    2f0b4bd8-b5bf-11df-ba1e-000255111976 Blog_this_caption
    Dr. Mark Drapeau
    9884ba04-b5bf-11df-947b-000255111976 Blog_this_caption
    Howard Weaver
    Bd7aafda-b5bf-11df-ba1e-000255111976 Blog_this_caption
    Jay Rosen
    E8315c88-b5bf-11df-8a6b-000255111976 Blog_this_caption
    JD Lasica
    F69e1a04-b5bf-11df-ba1e-000255111976 Blog_this_caption
    Jeff Jarvis
    23f3f186-b5c0-11df-afa4-000255111976 Blog_this_caption
    Jennifer Preston
    2ec13308-b5c0-11df-8a6b-000255111976 Blog_this_caption
    Kirk LaPointe
    6d3fc310-b5c0-11df-9d86-000255111976 Blog_this_caption
    Mark Glaser
    9d5b9790-b5c0-11df-8a6b-000255111976 Blog_this_caption
    Matthew Ingram
    Be0d0186-b5c0-11df-a76f-000255111976 Blog_this_caption
    Steve Buttry
    E8b17034-b5c0-11df-a110-000255111976 Blog_this_caption
    Steve Outing
    F7544f3a-b5c0-11df-9d86-000255111976 Blog_this_caption
    Steve Yelvington
    3023889e-b5c1-11df-8b50-000255111976 Blog_this_caption