Categories
management

Org Survey Part 1: Questions

I remember when I managed a 6 person team, and I always felt like I had a handle on what was going on (perhaps I’m being overly nostalgic here). Now I manage a ~26 person organisation, and on a good day I feel like I have a general idea of what’s happening, and certain specific […]

Categories
WISE women in computer science

You Get What You Incentivise

It’s about 18 months since my friend Tracy wrote this post pointing out that whilst the tech industry evangelises data for decision making, there is very little available when it comes to diversity numbers. And about 12 months since we started seeing companies release their numbers. Helped along by radical shareholder action from Jesse Jackson Sr. […]

Categories
Trends WISE women in computer science

Problems of Statistical Significance

I think one of the biggest problems for diversity, and for accountability of diversity, is one that we never talk about. Statistical significance. Imagine there is a company with 1000 engineers, of which 20% are women. The company declares their numbers proudly, saying they are beating the latest US graduation rate for women in Computer […]

Categories
mobile Programming

A Little Bit Of Data is a Dangerous Amount

When you have no data, everyone agrees: need more data. When you have a lot of data, what is happening is pretty clear. When you have a little bit of data, people can extrapolate. “It might show X”, “It might show Y”. Often declared without the caveats. Because “we don’t really know” is a much less compelling story, […]

Categories
Presentation Programming Social Networking Visualization

Part 8: Who’s Talking About The Future of Newspapers?

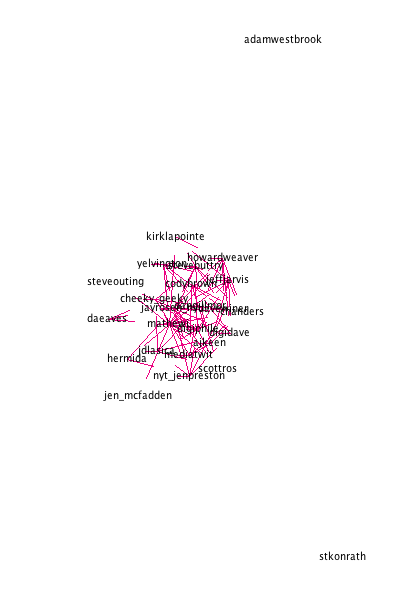
I’m working on a paper on topical communities, and as part of that I’ve come back to this dataset to explore the social network that emerges through @ mentions. To start with, I looked at the social network that emerges when we look at the people on the list. This network is pretty densely connected, […]

Categories
Presentation Programming Social Networking Visualization

Part 7: Who’s Talking About The Future of Newspapers?

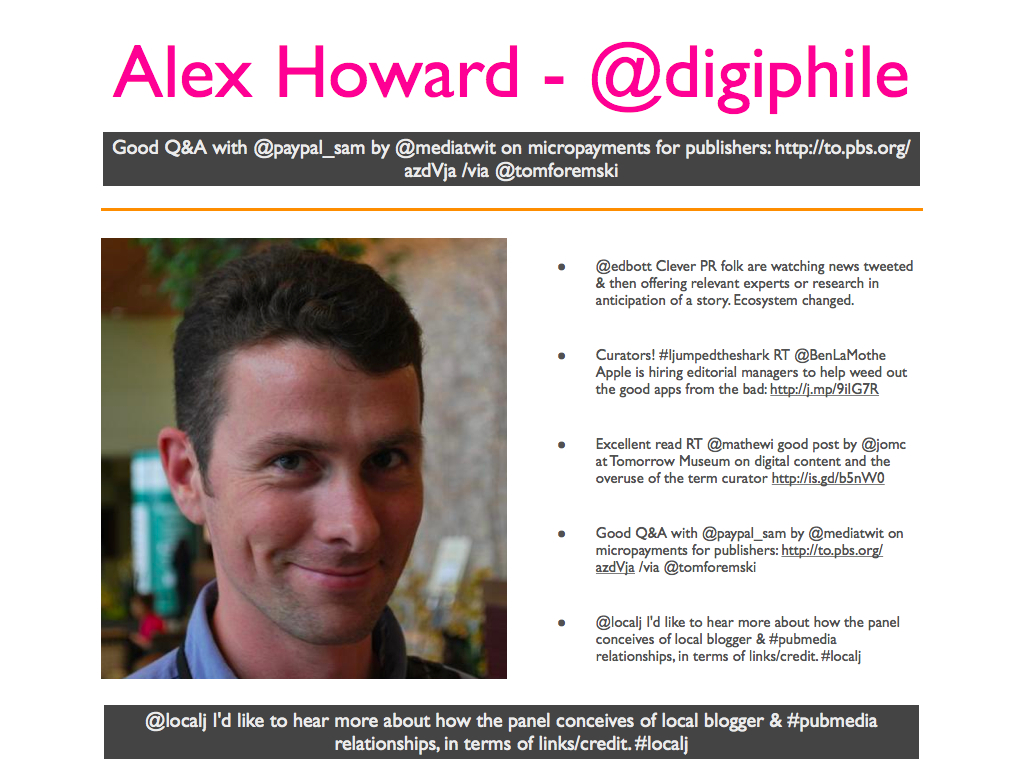
I used the Classifier4J Summarizer to summarize the tweets and pick out the 5 tweet summary of the period, and the 1 tweet summary of @ replies and non-directed tweets. Only letters and spaces were kept for the summary (thus each tweet was treated as one sentence), the summarizer transforms everything to lower case and […]

Categories
Social Networking Twitter Visualization

Part 6: Who’s Talking About The Future of Newspapers?

Continued on from Part 5, exploring what they are saying using the Phrase Net visualization from Many Eyes. Each image is a link to the applet where you can explore the text and interact with it. Change the linking word on the left – I’ve used space, but “and” or “is” in particular could be […]

Categories
Social Networking Twitter Visualization

Part 5: Who’s Talking About The Future Of Newspapers?

Continued on from Part 4, exploring what they are saying using Word Trees on Many Eyes. Each image is a link to the applet where you can explore the text and interact with it. Change the word in the top left corner to change the root of the tree. Alex Howard Alfred Hermida Andrew Keen […]

Categories
Programming Social Networking Twitter Visualization

Part 4: Who’s Talking About The Future Of Newspapers?

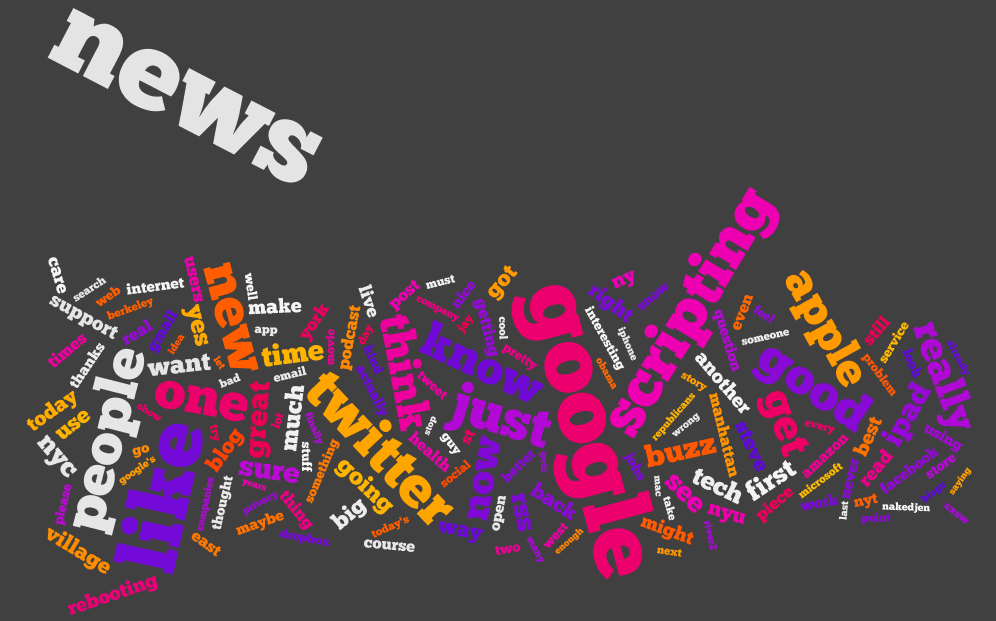
In which we answer the question – what are they saying? I’ve split the tweets up into two types – at replies, and not at replies, and a third which contains all tweets. I’ve created wordles of each one, for each of the 20 people we were following. If you haven’t – check out wordle.net. […]

Categories
Social Networking Twitter Visualization

Part 3: Who’s Talking About The Future Of Newspapers?

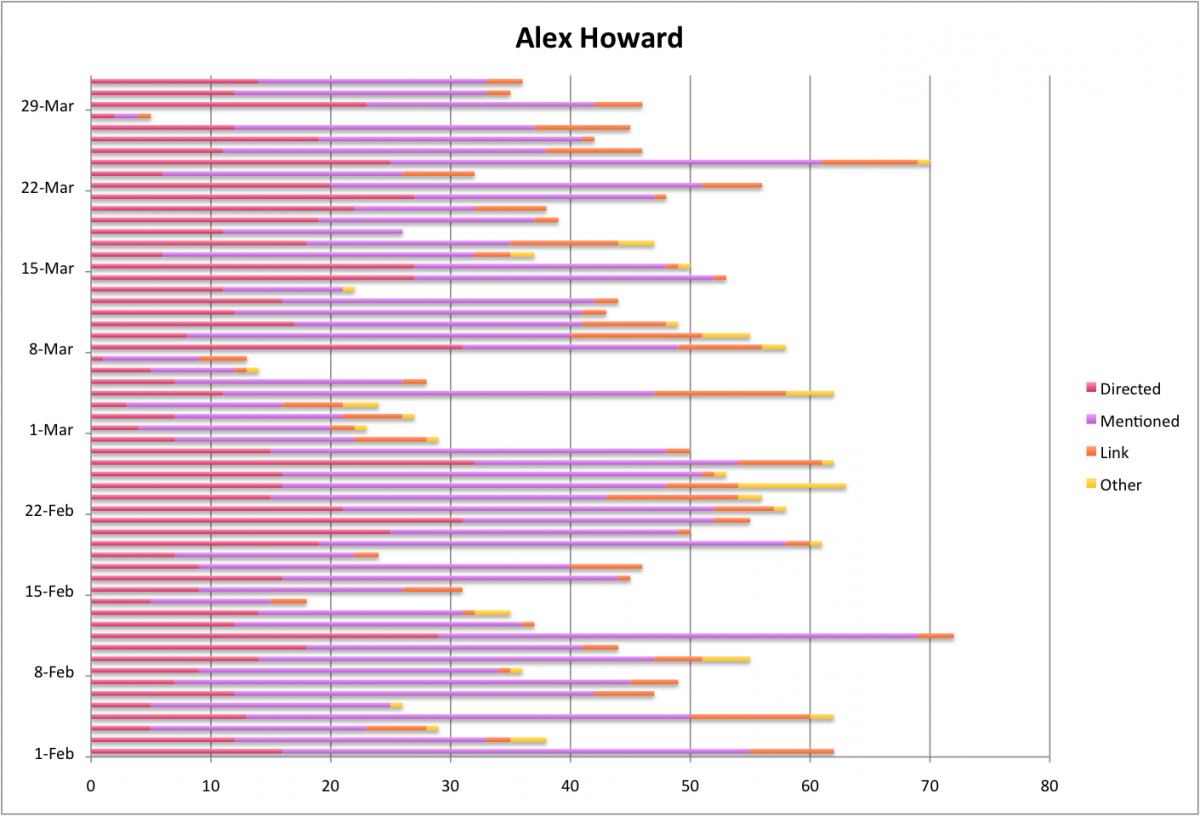
Continued on from Part 2, I’m representing similar data in a different (less exciting) way. Before, we looked at how the activity on the twitter streams was spread out over the day and by different types of interaction. Here, I’m using charts to show the breakdown for the day, by user. I’ve also created charts […]