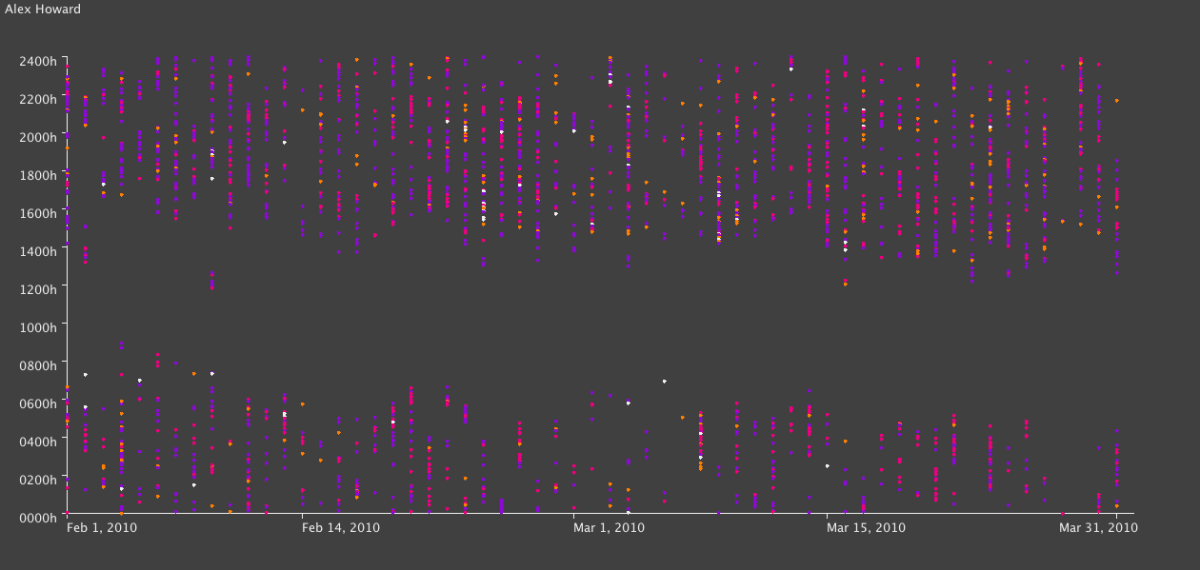
After breaking down the overall types of tweets from people, next step was to create scatter plots of their activity. Unfortunately, Excel will only plot 250 data points – how unreasonable! Luckily I love breaking Excel and coding something that will do what I want it to do and look prettier, so voila. Color scheme: […]
