Category: Visualization
-
I Wrote a Book Chapter and Finally, You Can Read It
My 2014 side project was a technical book chapter on image processing for the Architecture of Open Source 500 Lines or Less Project. It was my bête noire, that consumed various evenings and weekends either by actual work, or by guilt. 2015 was mainly guilt, and some editing. Recently the final copy edits came back,…
-
More Experiments Around RGB Averaging
I decided to replicate the showing/hiding the dominant hues in images with showing/hiding around the average RGB values instead. I created a class called RGBColor (just holds red, green, and blue values), similar to the one I created called HSBColor. I could have used the java.awt.Color class, but that insists on a range of 0-1…
-
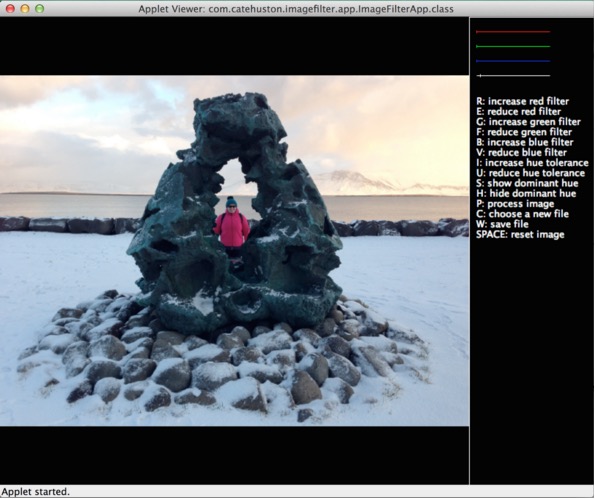
Eliminating the Dominant Hue from an Image
I thought it would be interesting to invert the idea of showing only the dominant hue, and show everything but that instead. I used the exact same code, but inverted the if statement so: if (!hueInRange(hue, lower, upper)) became if (hueInRange(hue, lower, upper)) Effect is as follows, as with most of these, my favourite effect…
-

Folders of Images, Compare and Contrast
Now I’ve experimented with things, I wanted to make something that would allow me to compare different effects on the same photo, and loop through a folder of pictures looking for nice effects. I overrode mousePressed() to change the image on click. The big challenge here was running out of Java Heap space once I…
-
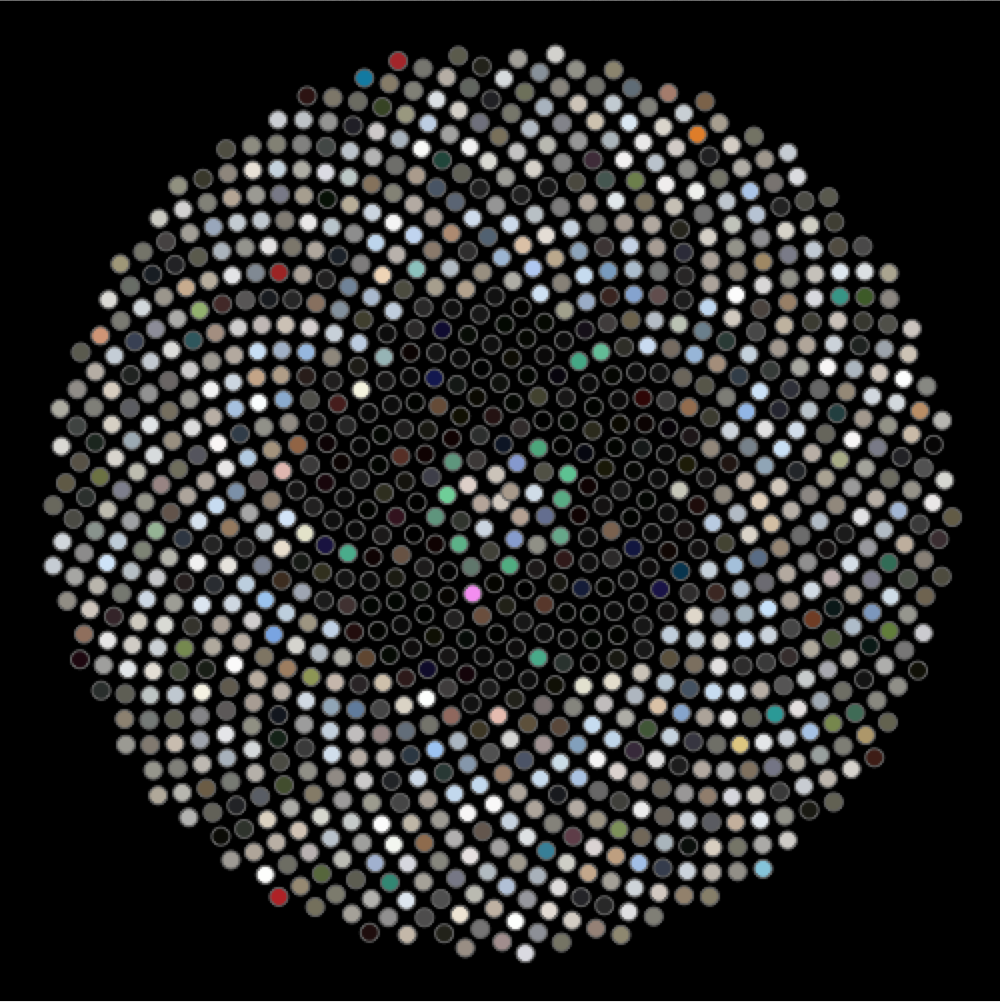
Visualising A Photo Series
Whenever I’m scrolling through pictures I’ve taken, it seem like they are in sections – here’s when I was near the beach, he’s the park, the night sky and fireworks. I thought if you visualised the way that the dominant colors changed, patterns would emerge. I found the perfect layout for this, the sunflower layout,…
-
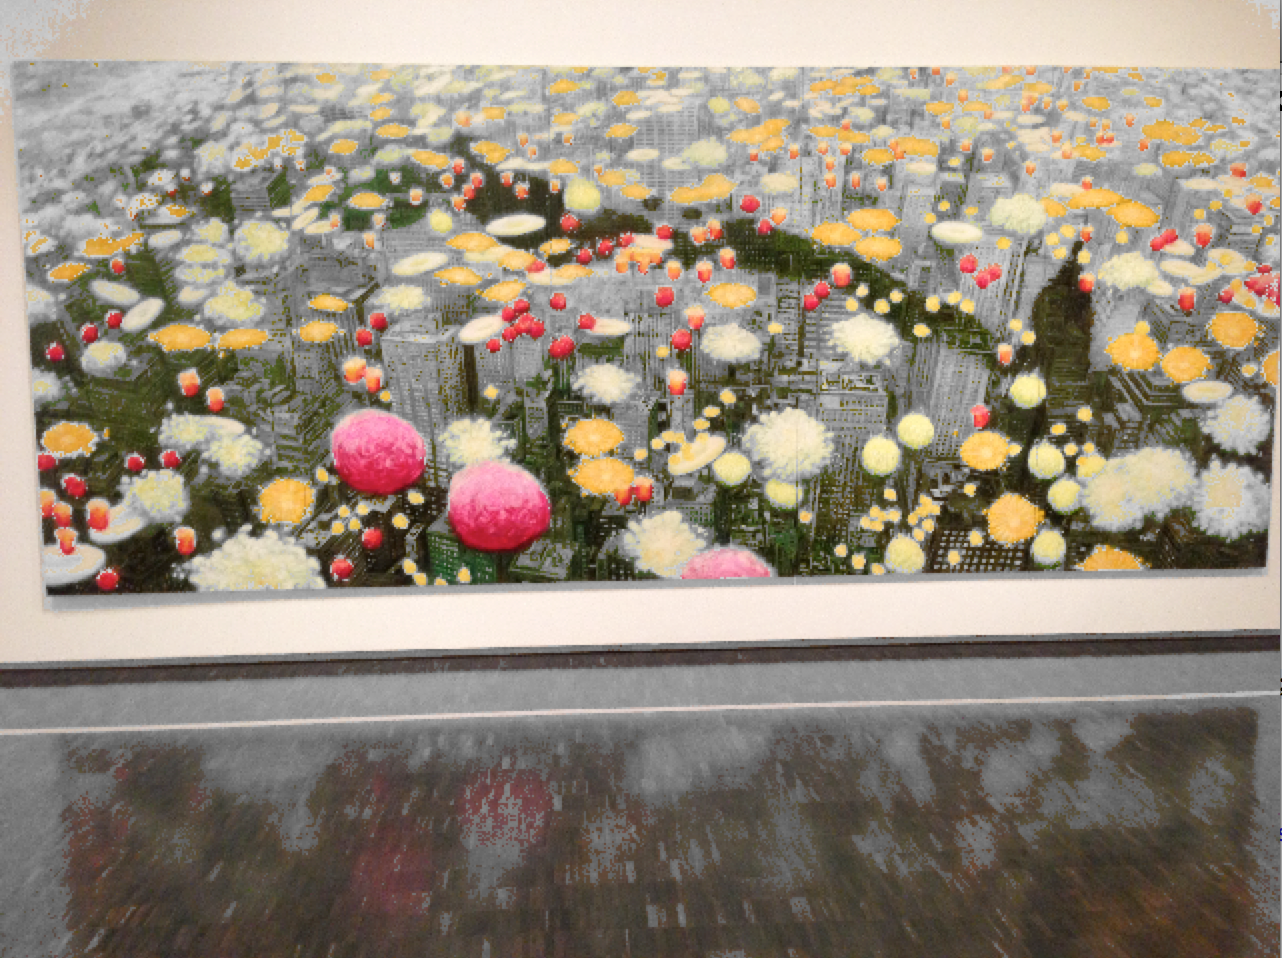
Showing Only the Dominant Hue In an Image
Having extracted the dominant hue from the images, we can manipulate the image such that pixels that are not (or close to) the dominant hue are instead made grayscale. I converted to grayscale using the brightness of the image in the HSB. This worked really nicely. From my earlier experiments I decided on a hue…
-
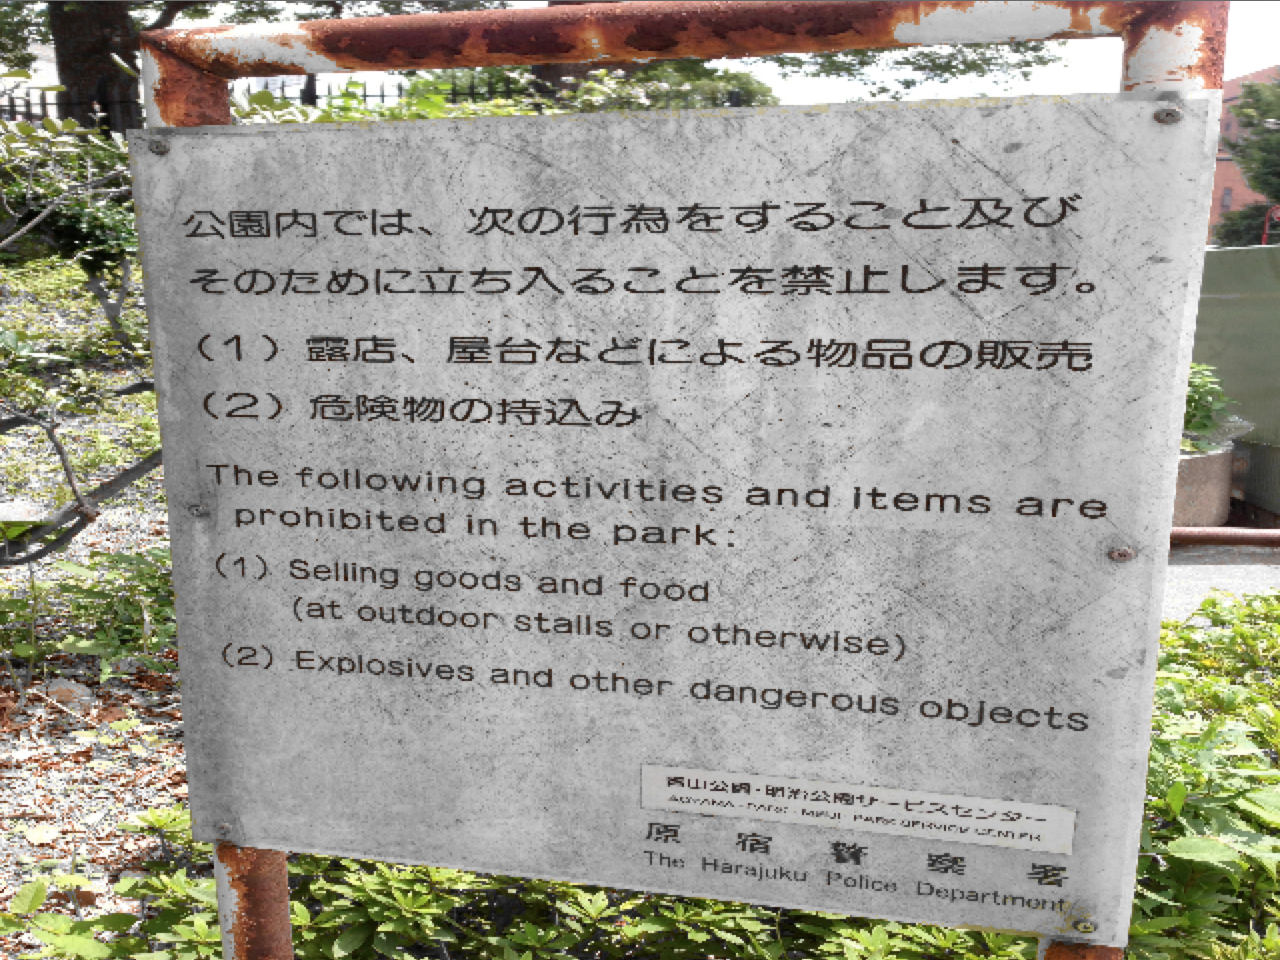
Extracting Dominant Color: RGB Averaging Doesn’t Work
This makes sense – two colors can have the same R values, but wildly different G and B values. The result of averaging them will bear no relation to the originals. However just to prove it, it was very easy to tweak my code to average the RGB values instead of counting the hues. The…
-

Extracting the Dominant Color from an Image in Processing
I’ve had an idea in mind for a while now, that requires extracting the dominant color from an image. I had no idea how to do this, and worried it would be really hard. The first thing was extracting the pixels from the image for processing, this was super easy thanks to this handy image…
-
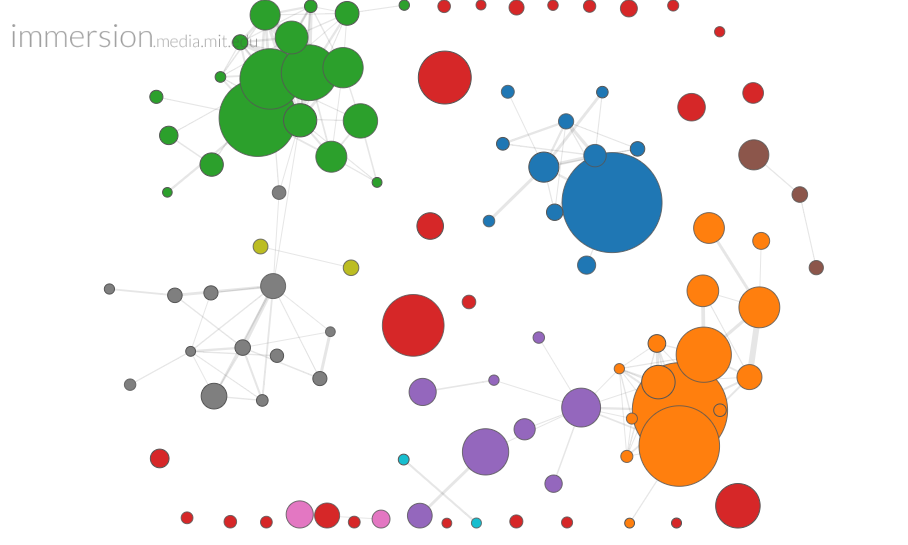
Immersion
When I read about Immersion – a tool created by researchers at MIT which maps your email network – of course I had to map mine. It’s fascinating. I’ve removed the labels for other people’s privacy, but high level breakdown of which group is which follows: Green/Grey on the left: Ottawa networks. Grey is University, Green is…