Tag: analysis

  • A Little Bit Of Data is a Dangerous Amount

    A Little Bit Of Data is a Dangerous Amount

    Data Center - NCC
    Credit: Flickr / Beraldo Leal

    When you have no data, everyone agrees: need more data.

    When you have a lot of data, what is happening is pretty clear.

    When you have a little bit of data, people can extrapolate. “It might show X”, “It might show Y”. Often declared without the caveats. Because “we don’t really know” is a much less compelling story, even if it is more accurate.

    But… we don’t really know.

    If you’re measuring the performance of a layout on your menu bar, with some actions exposed and some hidden away in a submenu, and you know that people more often tap the exposed options, you might declare success.

    But. A little more data might show people cancelling those actions disproportionately more.

    So now what do you know? That people aren’t always finding what they are looking for first try, that those options are not necessarily the ones that should be exposed.

    The answer is logging everything and (I would hope this is obvious) to the same place.

    And, when you think data has backed up a conclusion… think about whether you have all the data to really be sure about that.


  • Exploring a Conference Hashtag

    Exploring a Conference Hashtag

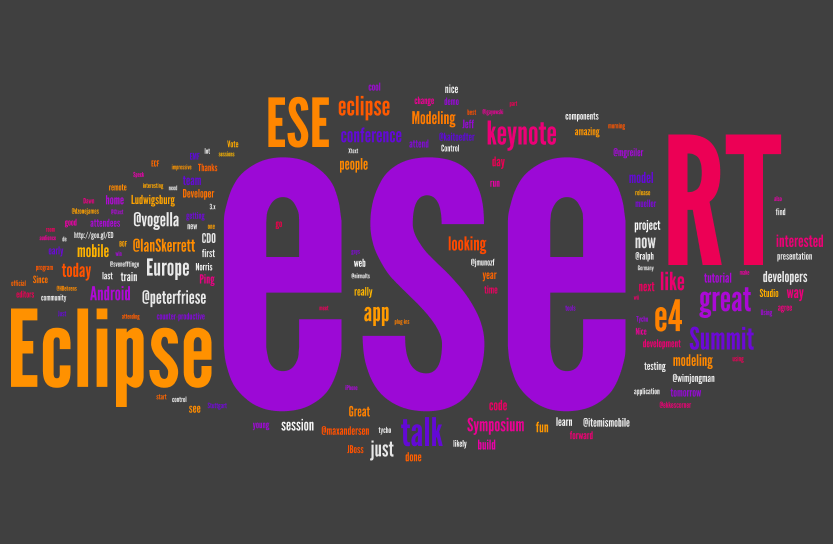
    My supervisor had the idea of grabbing a conference dataset by hashtag, specifically the Eclipse Conference 2010 (hashtag #ese) which took place in Ludwigsburg, Germany, November 2nd to November 4th.

    You can get an idea of what people were talking about in the wordle, below (applet is here):

    ESE All Tweets

    Apparently there were a lot of RT’s. We’ll explore that later…

    I started off with HTML files that he had grabbed for me, and extracted all the tweet ID’s (regular expressions ftw) and then downloading all the information for each tweet from the API (rate-limiting is the new compiling). Finally I had a spreadsheet with a total of 640 tweets (only one couldn’t be retrieved) from 181 different users.

    One user has a total of 26 tweets in the dataset, however the majority just tweeted the hashtag one time. The frequency distribution is shown in the chart, below.

    tweet count frequency

    The web and Tweetdeck were by far the most popular clients, as per the chart below. Of course, this can be skewed by users posting more.

    Twitter Clients

    To reduce this, I eliminated duplicates of user/source combinations to create the chart below:

    Client Usage (User Duplicates Removed)

    TweetDeck now seems slightly less popular! It’s interesting giving the tech-savvy of the users – Eclipse is an IDE, amongst other things, and is also Open Source that the web is so prevalent, and Android less so. Although Twitdroid and Twitter for Android are there they are both dominated by Twitter for iPhone.

    Just 38 of the 181 users use multiple clients, although one user uses 5 (!)

    Client Usage (User Duplicates Removed)

    Below is a heat map of the locations of the users for the tweets in the dataset. The conference took place in Europe, so many of the participants were from that area but we also see users from North America.

    [iframe: src=”http://www.openheatmap.com/embed.html?map=PheromonesMotherboardNightstick” frameborder=”0″ width=”600″ height=”450″ scrolling=”yes”]

    Only 8 tweets (out of the 640 tweet dataset), 1.25% had geo-location data, and just 75 or 11.7% were replies. 55 of user accounts (out of 181), or 30.4% are geo enabled.

    I filtered the dataset to keep just one tweet per user (the last one they posted with the conference hashtag).

    The location heatmap with the reduced dataset:

    [iframe: src=”http://www.openheatmap.com/embed.html?map=HypercriticallyThesaurussStruts” frameborder=”0″ width=”600″ height=”450″ scrolling=”yes”]

    Despite the worldwide locations, the vast majority of users have their language set to English:

    Languages

    How do people at the Eclipse Conference describe themselves? Wordles have limitations in terms of statistical significance, but I find them useful for picking out specific themes. The wordle for user’s bios is below (applet here), “Eclipse”, “software”, “Java” and “Developer” feature prominently.

    Bio Wordle

    The earliest user joined in December 2006, but some joined relatively recently – in the chart below, we see a spike around February/March 2009 (this makes sense, given the astounding growth of Twitter at that time).

    Joined Since

    Personally, I use my favorites to collect things I mean to read. So I had a look at how these users were favoriting too. Users had between 0 and 2366 favorites. A median of 43.9, median of 3, and mode of 0 suggest that many of these users don’t use favourites at all. Standard Deviation was obviously large – 204.23.

    I graphed follower/following with size proportional to number of lists using Many Eyes.

    24e29d64-f34a-11df-a448-000255111976

    Blog_this_caption

    Finally – URLs. I was surprised that 54 (29.8%) of users did not have a URL in their profile. 3, shockingly, have a Facebook URL (one of which does not have the vanity URL). Blogspot (22 users) is more popular than WordPress (5 users).

    Next I’ll be looking at temporal rhythms and mapping @ mentions.

  • My Journal is Online

    WTJ 94 - Write a list of more ways to wreck this journal
    Credit: flickr / isazappy

    Now that my iPhone is unlocked (yay!) and has a data plan, I can play Foursquare. Which is exciting for me, but I know some people hate it and my boyfriend has been getting all angsty about giving up my privacy for nothing.

    The thing is though, I love tracking things. I track the applications I use, and the music I listen to. I track random things on Mycrocosm. I track my todo list through Remember the Milk and my goals page and I use various applications for tracking how I’m doing on Twitter (am I tweeting too much? Tweeting stuff that’s interesting?). I track my blog stats through Google Analytics which means I can say that when I added related posts to my blog, my bounce rate went down. I’m a bit of a data junkie, I guess. But that is probably fitting considering that to describe what I like to work on I’ve taken to saying, “I take data and try and present and organize it in a way such that I can answer questions that you didn’t think to ask.”

    Not everyone is interested in doing this, of course. But I’ve been thinking about why I like to document my life and track it online like this and I have an answer. And no, it’s not that I’m self-obsessed and want everyone to know exactly what I’m doing, all the goddamn time. It’s my way of keeping a journal – the journal I tried to keep at numerous points growing up, but never had the dedication to stick with. It’s easier! I track my music and application use just by running stuff in the background. My task lists are a little more arduous to maintain, but they can be updated anywhere and the payoff in terms of organization is well worth the time. Twitter allows me to keep track of funny or useful articles I find online and document the highlights of my days in snippets, now I archive my tweets into weekly blogposts for easier searching. My blog is a history of things I’ve thought about and worked on, it documents my ideas and is search-able, and sometimes I find things in the related posts section that I’ve forgotten I wrote.

    Now with Foursquare, I can keep track of where I’ve been. And I get that it’s annoying when your every check-in gets posted to your Twitter or Facebook stream, so I don’t do that. Currently it’s set to post only badges and mayorships, but I’ll turn that off if they’re frequent occurrences. Here’s what I’m getting out of it:

    Ambient Awareness

    I’m a big fan of this idea, I like the ease of keeping track of people and staying in touch this way, rather than the long “this is everything I’ve done in the last month” emails. And I suck at writing emails anyway (working on replying, I’m getting better at it), so nobody gets those from me. This makes it all the more useful to have places where people who are interested in what I’m up to but can’t be bothered to write the email and wait for the response can keep up with me, and hopefully I can keep up with them in return. If you’re not that person and my content is boring, I’m sorry – but it’s not meant for you. I tend to use Facebook for this, because it’s closed and I tend to limit it to people I know, but I think Foursquare can potentially be nice for that too.

    Serendipitous Meetings

    OK, this hasn’t happened yet but I hope it will. If I’m in Starbucks and you’re nearby and fancy a coffee then maybe you’ll come by and hang out. That’s kinda cool! And the other day when I was meeting friends at a restaurant, I knew one of them was there because his Foursquare check-in popped up on my phone. That’s potentially useful, too.

    Competition

    I really want to be Mayor of where I kickbox. Perhaps some people might find that a little sad, but if it gets me training more isn’t that a good thing? Competition encourages me to get out there, and visit new places. It’s pretty cold in Ottawa right now – the more motivation to get out and about, the better.

    How about you? Do you think Foursquare and services like that are stupid, or do you use them? And if so, why – what do you get out of it?