Category: Visualization
-
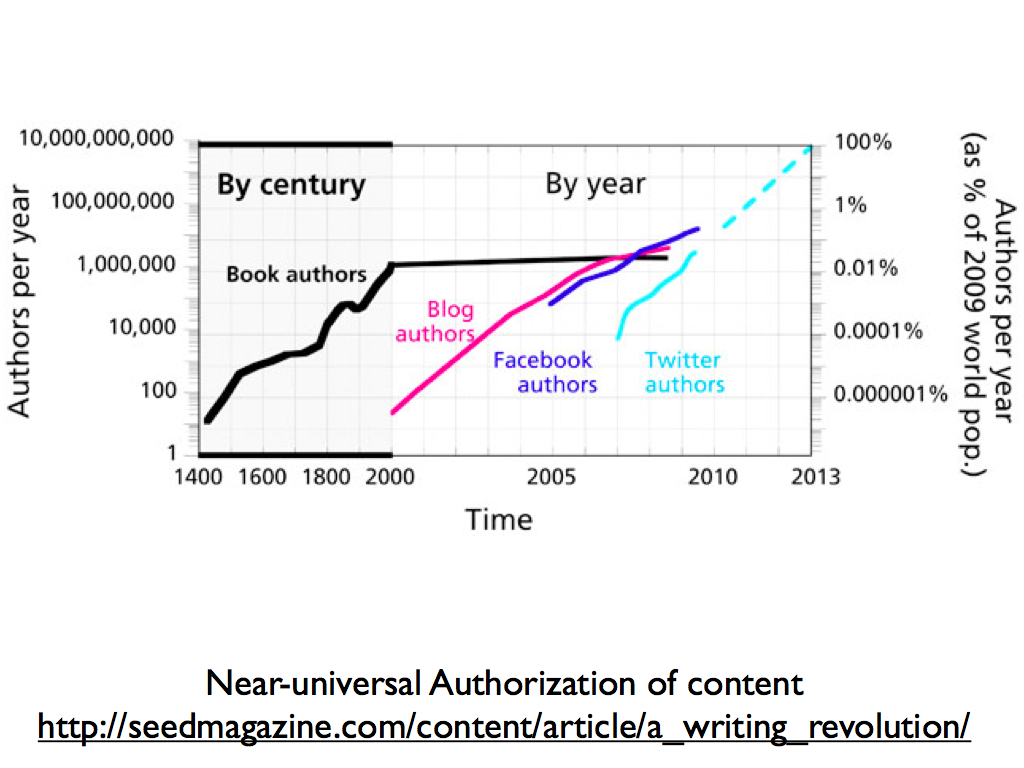
Science Teacher Talk: Information -> Meaning
Initial draft of a talk I’m supposed to be giving in February. Information -> Meaning Before the printing press, literacy rates were really low, and the average book was the bible. This was all people had by way of information. The printing press caused a revolution. 100 years later, humans had more information than they…
-
Fun With Prefuse
Couple of things I found using Prefuse that I’ll document here for reference (I had a hard time finding the answer to these). 1. NullPointerException thrown by GraphMLReader This means there’s an issue in the XML, even if it’s valid according to W3Schools (which mine was). Double check it, for me it was an issue…
-
Release Time!
Really excited to release the applets of my Twitter Conversation Networks, and also the Clique visualizations. Details here. I’m providing the option to get priority by making a loan on uOttawa WISE’s Kiva lending team. Although much of it is automated, each one takes me a little time to make, plus there is the time…
-

Art, Life and Programming: Programming
Earlier, we talked about how programmers weren’t perhaps what you expect. Code isn’t either. Programmers used to program using series of 1’s and 0’s punched into cards (crikey!) but that’s not the case any more. Program code has got more and more high level, and some languages are actually quite readable by humans! Some programming…
-
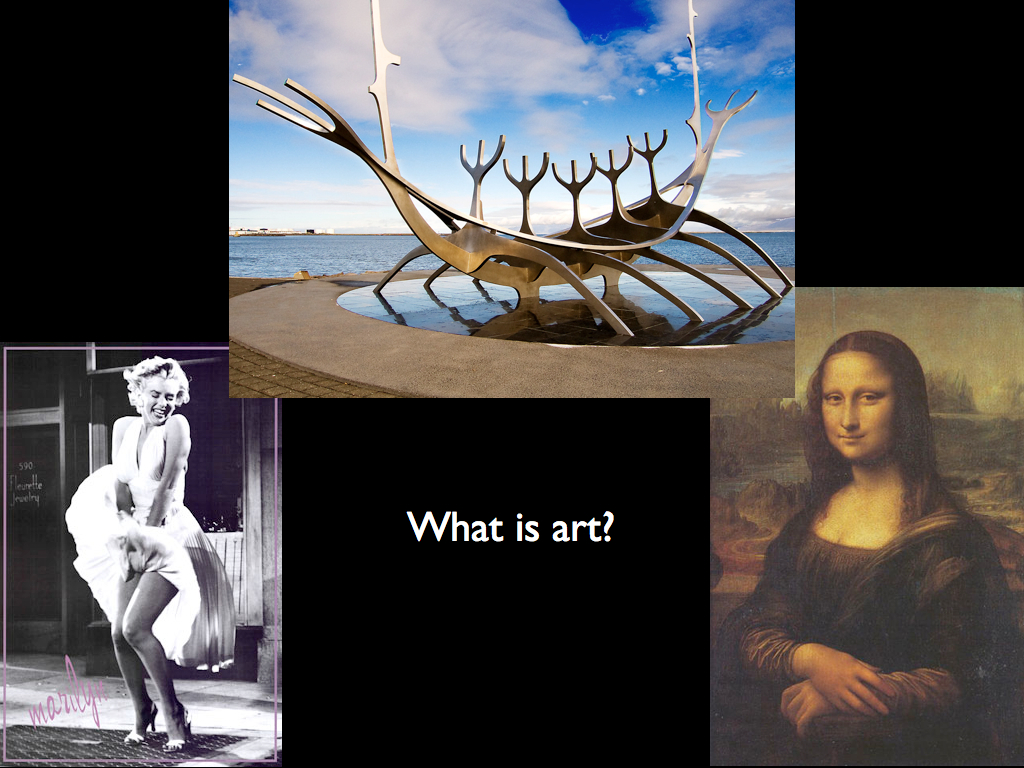
Art, Life and Programming: Art
Credit: flickr / e-strategyblog.com, flickr / david.nikonvscanon, flickr / Joaquín Martínez Rosado What is art anyway? A painting in a museum? A sculpture? An iconic photograph? All of that and more? Art is a product of human creativity, and there are various medium we can use for it. Technology is changing art, because it provides…